

The stock market, a bustling ecosystem of buying and selling securities, often feels like an enigma to those outside its realm. Understanding its complex dynamics can seem daunting, yet it holds the key to unlocking potentially lucrative opportunities. In this comprehensive guide, we will delve into the intricate world of the stock market, providing you with a roadmap for analyzing trends, making informed decisions, and potentially navigating your way to financial success.
From identifying market indicators to interpreting technical analysis, we will equip you with the knowledge to decipher the language of the stock market. Whether you are a seasoned investor or a curious newcomer, this guide will serve as your gateway to navigating the world of stocks, bonds, and the ever-evolving landscape of financial markets.
Fundamentals of the Stock Market: A Beginner’s Guide

The stock market can be a daunting and confusing world for beginners. However, understanding the fundamentals is essential for making informed investment decisions. This guide aims to provide a comprehensive overview of the stock market, covering key concepts, types of investments, and how to get started.
What is the stock market?
The stock market is a marketplace where publicly traded companies issue and sell shares of ownership to investors. These shares, known as stocks, represent a portion of the company’s ownership and allow investors to participate in its profits and potential growth. The stock market provides a platform for companies to raise capital and for investors to invest in businesses they believe will be successful.
Types of Investments
There are two main types of investments in the stock market:
- Stocks: Represent ownership in a company, giving investors the right to share in its profits and losses.
- Bonds: Are essentially loans made to companies or governments, promising fixed interest payments over a specified period.
Key Concepts
Understanding these key concepts is crucial for navigating the stock market:
- Market Capitalization: The total value of a company’s outstanding shares.
- Price-to-Earnings Ratio (P/E Ratio): A measure of a company’s stock price relative to its earnings per share.
- Dividend: A portion of a company’s profits paid out to shareholders.
- Bull and Bear Markets: A bull market signifies an upward trend in stock prices, while a bear market indicates a downward trend.
- Risk and Return: Higher potential returns generally come with higher risks.
Getting Started
Before diving into the stock market, it’s essential to:
- Educate yourself: Read books, take courses, and research online resources to gain a solid understanding of the stock market.
- Define your investment goals: What are you hoping to achieve with your investments? How much risk are you willing to take?
- Choose a brokerage account: Select a reputable brokerage that offers the tools and features you need.
- Start small: Begin with a small amount of money and gradually increase your investments as you gain experience.
Important Considerations
Investing in the stock market involves risks. It’s crucial to:
- Diversify your portfolio: Spread your investments across different asset classes and sectors to mitigate risk.
- Invest for the long term: Don’t try to time the market or make short-term trades. The stock market is a long-term game.
- Stay informed: Keep up with current market trends, news, and company developments.
Understanding Market Cycles and Trends
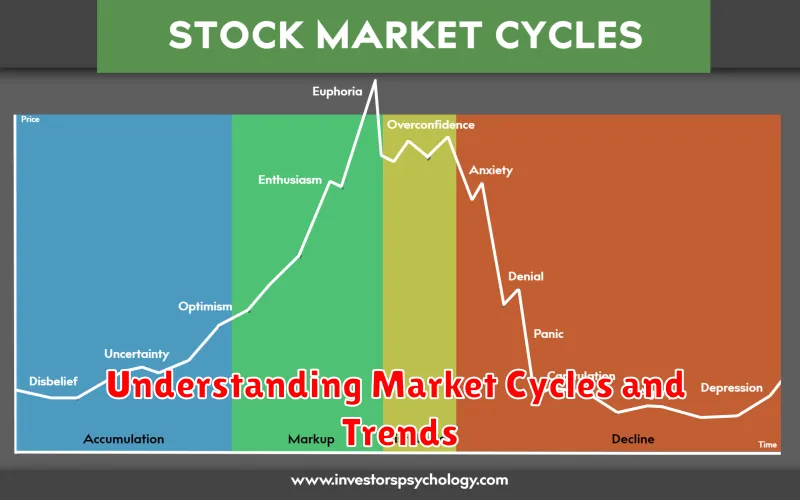
In the dynamic world of finance, understanding market cycles and trends is crucial for informed decision-making. Market cycles, characterized by recurring patterns of expansion and contraction, offer insights into the ebb and flow of economic activity. These cycles are driven by various factors, including consumer confidence, interest rates, technological advancements, and government policies. By comprehending the underlying forces that shape these cycles, investors can gain a competitive edge in navigating the markets.
One prominent market cycle is the business cycle, which encompasses periods of economic expansion, peak, contraction (recession), and trough. During an expansionary phase, economic indicators such as GDP growth, employment, and consumer spending rise. As the economy reaches its peak, these indicators begin to slow down, signaling the onset of a contractionary phase. This period is characterized by declining economic activity, job losses, and reduced consumer spending. The trough marks the bottom of the cycle, after which the economy gradually recovers and enters a new expansionary phase.
Another important market cycle is the stock market cycle. This cycle is closely tied to the business cycle, with stock prices generally rising during economic expansions and falling during contractions. However, it is essential to note that stock market cycles can deviate from the business cycle, as investor sentiment, corporate earnings, and other factors play a significant role. Understanding the different phases of the stock market cycle, such as bull markets (characterized by sustained price increases) and bear markets (characterized by sustained price declines), can help investors make more informed decisions.
In addition to the business and stock market cycles, investors should also consider sectoral cycles. These cycles reflect the performance of specific industries, such as energy, technology, or healthcare. Sectoral cycles can be influenced by various factors, such as technological advancements, regulatory changes, and consumer preferences. By identifying industries poised for growth or decline, investors can allocate their portfolios accordingly.
To effectively navigate market cycles, investors can employ various tools and strategies. Technical analysis, which focuses on chart patterns and historical price movements, can provide insights into potential market trends. Fundamental analysis, which examines a company’s financial statements and underlying business operations, can help assess the intrinsic value of an investment. Moreover, investors should pay attention to economic indicators such as inflation, interest rates, and unemployment, as these indicators can provide clues about the direction of the economy and markets.
By understanding market cycles and trends, investors can enhance their decision-making process and navigate the complexities of the financial markets. By staying informed about economic conditions, industry dynamics, and investor sentiment, investors can position themselves for success in the long run.
Technical Analysis: Charts, Patterns, and Indicators

Technical analysis is a method of forecasting the future price movement of a security by studying past price and volume data. Technical analysts believe that past price action can predict future price action, and they use a variety of charts, patterns, and indicators to identify trading opportunities.
Charts
Charts are the most basic tool used by technical analysts. They display the price of a security over time, and they can be used to identify trends, support and resistance levels, and other important patterns. There are many different types of charts, but the most common are:
- Line chart: A line chart connects the closing prices of a security over a period of time.
- Bar chart: A bar chart displays the open, high, low, and closing prices of a security for each period.
- Candlestick chart: A candlestick chart is a type of bar chart that uses different colors to represent the open, high, low, and closing prices.
Patterns
Technical analysts look for recurring patterns in charts that can signal future price movement. Some common patterns include:
- Head and shoulders: This pattern is a bearish reversal pattern that suggests a downtrend is about to begin.
- Double top: This pattern is a bearish reversal pattern that suggests a downtrend is about to begin.
- Triple bottom: This pattern is a bullish reversal pattern that suggests an uptrend is about to begin.
- Flag: This pattern is a continuation pattern that suggests the existing trend will continue.
Indicators
Technical indicators are mathematical formulas that are applied to price data to generate signals. Some common indicators include:
- Moving average: A moving average is a trend-following indicator that smooths out price fluctuations.
- Relative strength index (RSI): The RSI is a momentum indicator that measures the magnitude of recent price changes to evaluate overbought or oversold conditions in the price of a stock or other asset.
- MACD: The MACD is a trend-following momentum indicator that shows the relationship between two moving averages of prices.
Technical analysis is a valuable tool for traders, but it is important to remember that it is not a perfect system. Technical analysis should be used in conjunction with other forms of analysis, such as fundamental analysis, to make informed trading decisions. It is also important to use stop-loss orders to limit potential losses.
Fundamental Analysis: Evaluating Company Performance
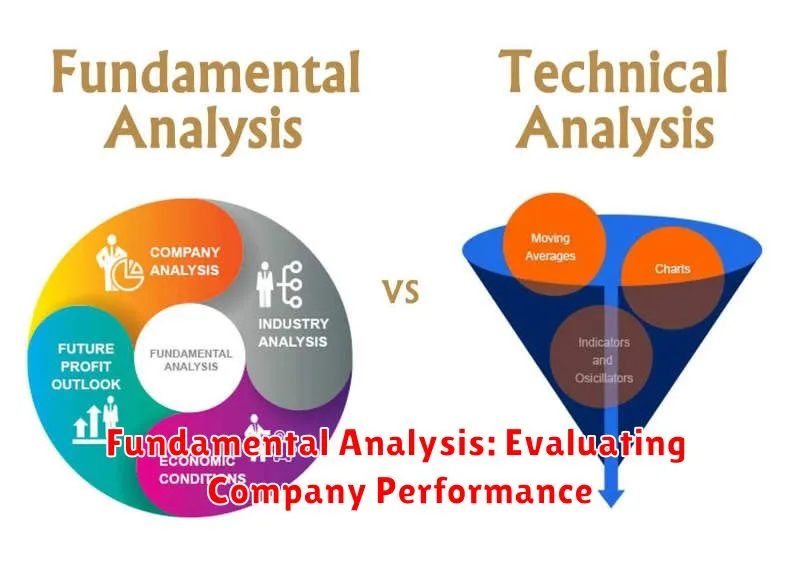
Fundamental analysis is a method of evaluating a company’s intrinsic value by examining its financial statements and other relevant data. This process involves analyzing the company’s past performance, current financial health, and future prospects. It is a crucial tool for investors who want to make informed decisions about buying or selling stocks.
The main goal of fundamental analysis is to determine if a company’s stock price is justified by its underlying financial performance. Investors can determine if a company is undervalued or overvalued by comparing the company’s current market value with its intrinsic value. This approach helps investors identify opportunities to buy undervalued companies or sell overvalued ones.
Key Elements of Fundamental Analysis
Fundamental analysis typically involves examining the following key areas:
- Financial Statements: This includes the income statement, balance sheet, and statement of cash flows. These documents provide insights into the company’s profitability, liquidity, and solvency.
- Management Quality: Assessing the competency and integrity of the company’s management team is crucial. Strong leadership can create a sustainable competitive advantage and drive long-term growth.
- Industry Analysis: Understanding the industry in which the company operates is essential. Analyzing industry trends, competitive landscape, and growth potential can reveal valuable insights about the company’s future prospects.
- Valuation Ratios: Fundamental analysts use various financial ratios to assess a company’s value relative to its peers and historical performance. Some commonly used ratios include the price-to-earnings ratio (P/E), price-to-book ratio (P/B), and return on equity (ROE).
- Economic Conditions: External economic factors like interest rates, inflation, and economic growth can significantly impact a company’s performance. Analysts need to consider these factors when evaluating a company’s future prospects.
Benefits of Fundamental Analysis
Fundamental analysis offers several benefits to investors, including:
- Informed Decision Making: By analyzing financial data and other relevant information, investors can make more informed decisions about their investments.
- Long-Term Perspective: Fundamental analysis focuses on a company’s intrinsic value, which is based on its long-term performance and potential. This approach helps investors avoid short-term market fluctuations and make investments based on solid fundamentals.
- Risk Mitigation: By identifying companies with strong financial health and good management, investors can reduce their investment risk.
- Potential for Higher Returns: Identifying undervalued companies through fundamental analysis can lead to potentially higher returns compared to investing in overvalued companies.
Conclusion
Fundamental analysis is an essential tool for investors who want to make informed investment decisions. By examining a company’s financial performance, management quality, and industry outlook, investors can gain valuable insights into its intrinsic value and potential for future growth. This approach can help investors make more informed decisions about their investments and potentially achieve higher returns over the long term.
Economic Indicators and Their Impact on Stocks

Economic indicators are statistics that provide insight into the economic health of a country or region. They can be used to track economic growth, inflation, unemployment, and other key factors that impact the stock market. Investors use these indicators to make informed decisions about their investments.
There are many different types of economic indicators, but some of the most important include:
- Gross Domestic Product (GDP): This is the total value of goods and services produced in a country over a specific period. A strong GDP growth rate is generally positive for the stock market.
- Inflation: This is a measure of the rate at which prices are increasing. High inflation can be bad for the stock market because it can erode the value of investments.
- Unemployment Rate: This is the percentage of the labor force that is unemployed. A low unemployment rate is generally good for the stock market because it indicates a strong economy.
- Consumer Price Index (CPI): This measures the average change in prices paid by urban consumers for a basket of consumer goods and services.
- Producer Price Index (PPI): This measures the average change in prices received by domestic producers for their output.
- Interest Rates: These are the costs of borrowing money. High interest rates can be bad for the stock market because they make it more expensive for businesses to borrow money to invest and grow.
Economic indicators can be used to make informed investment decisions. For example, if an investor is concerned about rising inflation, they may choose to invest in stocks of companies that are expected to be able to pass on higher prices to consumers. Or, if an investor is concerned about a recession, they may choose to invest in stocks of companies that are considered to be defensive, meaning they are less likely to be affected by an economic downturn.
It is important to note that economic indicators are not perfect predictors of the stock market. They are simply one piece of the puzzle that investors use to make informed decisions. There are many other factors that can impact the stock market, such as political events, technological advancements, and consumer confidence.
Investors should use economic indicators in conjunction with other sources of information to make informed investment decisions. They should also be aware of the limitations of economic indicators and understand that they are not always accurate or reliable.
Reading Financial Statements for Stock Analysis

Financial statements are the backbone of any stock analysis. They provide a window into a company’s financial health, allowing investors to assess its profitability, liquidity, and solvency. By carefully scrutinizing these statements, investors can gain valuable insights into a company’s past performance and future prospects.
Key Financial Statements
The three primary financial statements that investors should focus on are:
- Income Statement: This statement shows a company’s revenues, expenses, and net income over a specific period. It reveals how profitable a company is and how efficiently it manages its operations.
- Balance Sheet: This statement provides a snapshot of a company’s assets, liabilities, and equity at a specific point in time. It highlights the company’s financial structure, including its debt levels and the sources of its financing.
- Statement of Cash Flows: This statement tracks the movement of cash in and out of a company, categorized into operating, investing, and financing activities. It sheds light on a company’s cash flow generation, its investments, and its financing activities.
Analyzing Financial Ratios
Financial ratios provide a powerful tool for comparing a company’s performance to its industry peers and to its own historical performance. Here are some key ratios to consider:
- Profitability Ratios: These ratios measure a company’s ability to generate profits, such as gross profit margin, operating profit margin, and net profit margin.
- Liquidity Ratios: These ratios assess a company’s ability to meet its short-term obligations, such as the current ratio and quick ratio.
- Solvency Ratios: These ratios measure a company’s ability to meet its long-term obligations, including the debt-to-equity ratio and times interest earned ratio.
- Efficiency Ratios: These ratios evaluate how efficiently a company uses its assets, such as inventory turnover ratio and asset turnover ratio.
Understanding Trends and Changes
Financial statements are more than just a collection of numbers. They tell a story about a company’s financial performance over time. Investors should pay close attention to trends and changes in key metrics, such as revenue growth, profit margins, and debt levels. Significant deviations from historical patterns may warrant further investigation.
Beyond the Numbers
While financial statements are essential for stock analysis, they are not the only factor to consider. Investors should also consider qualitative factors, such as a company’s competitive landscape, management quality, and industry trends. A comprehensive analysis takes into account both financial and non-financial information.
Industry Analysis: Identifying Sector-Specific Trends

Industry analysis is a crucial aspect of business strategy and decision-making. It involves examining the dynamics of a specific industry or sector to understand its current state, future prospects, and key factors influencing its performance. By conducting a thorough industry analysis, businesses can gain valuable insights that inform their strategic choices, market positioning, and investment decisions.
One of the primary goals of industry analysis is to identify sector-specific trends. These trends represent the evolving patterns, forces, and developments within a particular industry that shape its trajectory. By recognizing these trends, businesses can capitalize on emerging opportunities, mitigate potential risks, and adapt their strategies to stay ahead of the competition.
Key Factors to Consider in Industry Analysis:
Several key factors contribute to the analysis of an industry. These include:
- Market Size and Growth: Determining the overall size of the industry and its anticipated growth rate provides valuable insights into the potential market opportunity.
- Competitive Landscape: Understanding the competitive landscape involves identifying key players, their market shares, competitive advantages, and strategies. This information helps businesses assess their competitive position and develop effective strategies.
- Technological Advancements: Technological advancements can significantly impact an industry, creating new opportunities, disrupting existing business models, and shaping future trends.
- Regulatory Environment: Government regulations and policies can influence an industry’s operating environment, affecting factors such as product standards, pricing, and market access.
- Economic Conditions: Economic factors, such as inflation, interest rates, and consumer confidence, can have a significant impact on industry performance.
- Consumer Behavior: Understanding consumer preferences, buying habits, and emerging trends is crucial for businesses to tailor their offerings and marketing strategies.
Methods for Industry Analysis:
Various methods are employed to conduct industry analysis. Some commonly used approaches include:
- Porter’s Five Forces: This framework analyzes the competitive forces within an industry, including the threat of new entrants, the bargaining power of buyers and suppliers, the threat of substitutes, and the intensity of rivalry among existing competitors.
- PESTLE Analysis: This framework examines the political, economic, social, technological, legal, and environmental factors affecting an industry.
- SWOT Analysis: This framework identifies the strengths, weaknesses, opportunities, and threats faced by a particular company or industry.
- Value Chain Analysis: This analysis breaks down the activities involved in creating and delivering a product or service, highlighting opportunities for improvement and innovation.
Benefits of Industry Analysis:
Conducting a comprehensive industry analysis offers numerous benefits to businesses, including:
- Enhanced Strategic Decision-Making: By understanding industry trends and competitive dynamics, businesses can make more informed and effective strategic choices.
- Improved Market Positioning: Industry analysis helps businesses identify market opportunities, target specific customer segments, and develop competitive advantages.
- Enhanced Risk Management: By recognizing potential threats and challenges, businesses can develop strategies to mitigate risks and navigate uncertainties.
- Improved Resource Allocation: Industry analysis guides businesses in allocating resources effectively to areas with the greatest potential for growth and profitability.
Conclusion
Quantitative Analysis: Using Data to Make Informed Decisions
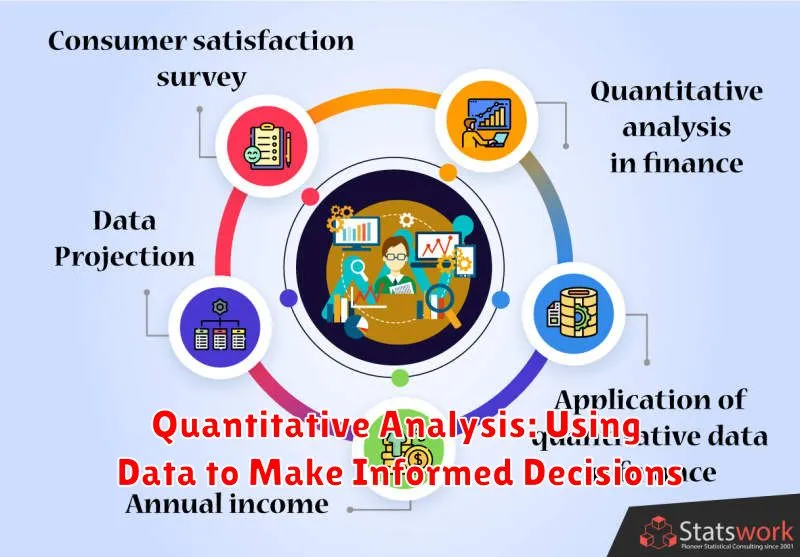
In today’s data-driven world, quantitative analysis has become an indispensable tool for businesses and organizations seeking to make informed decisions. By leveraging the power of numbers, quantitative analysis provides insights that can help optimize processes, identify trends, and ultimately drive success.
At its core, quantitative analysis involves collecting, cleaning, and analyzing numerical data to extract meaningful information. This process often involves using statistical methods, mathematical models, and specialized software to identify patterns, relationships, and trends within the data. The insights derived from this analysis can then be used to inform decision-making in various aspects of an organization, from marketing and sales to finance and operations.
One of the key benefits of quantitative analysis is its ability to provide objective evidence to support decision-making. By relying on data rather than intuition or subjective opinions, organizations can make more informed choices that are less prone to bias. This objectivity is particularly valuable in situations where decisions have significant financial or operational implications.
Furthermore, quantitative analysis enables organizations to identify opportunities that might otherwise go unnoticed. By analyzing data, businesses can uncover hidden patterns, identify emerging trends, and gain a deeper understanding of their customers and markets. This information can then be used to develop new products and services, tailor marketing campaigns, and optimize business strategies.
In addition to its analytical capabilities, quantitative analysis also plays a crucial role in measuring and evaluating performance. By tracking key metrics and analyzing data over time, organizations can monitor their progress, identify areas for improvement, and measure the effectiveness of their initiatives. This data-driven approach allows for a more objective and accurate assessment of performance, leading to more effective decision-making and continuous improvement.
In conclusion, quantitative analysis is an essential tool for any organization seeking to make informed decisions based on objective evidence. By leveraging the power of data, businesses and organizations can gain valuable insights, identify opportunities, optimize processes, and drive success in today’s competitive landscape.
Risk Management in Stock Market Investing

The stock market is a complex and unpredictable environment, and even the most experienced investors can encounter losses. Therefore, effective risk management is crucial for any investor looking to protect their capital and maximize their potential returns. Risk management involves identifying, assessing, and mitigating potential risks associated with stock market investments. It’s a proactive approach that helps investors make informed decisions and avoid unnecessary losses.
Diversification is a fundamental principle of risk management. By spreading investments across different asset classes, sectors, and geographical regions, investors can reduce the impact of any single investment’s performance on their overall portfolio. A diversified portfolio is less susceptible to market volatility and can help protect against significant losses.
Setting Stop-Loss Orders is another essential risk management strategy. These orders automatically sell a stock when it reaches a predetermined price, limiting potential losses. Stop-loss orders act as a safety net, preventing significant drawdowns in the event of an adverse price movement.
Investing within Your Risk Tolerance is paramount. Every investor has a different risk appetite, and it’s vital to invest only in assets that align with their comfort level. Understanding your risk tolerance involves assessing your financial goals, time horizon, and ability to withstand market fluctuations. By staying within your risk tolerance, you can avoid making impulsive decisions driven by fear or greed.
Regular Portfolio Review is crucial for effective risk management. It involves periodically assessing your investment strategy and making adjustments as needed. Market conditions change constantly, and your investment portfolio may need to be rebalanced to ensure it remains aligned with your goals and risk tolerance. By reviewing your portfolio regularly, you can identify potential risks early and take proactive steps to mitigate them.
Avoiding Over-Leveraging is crucial. While borrowing money can amplify returns, it also amplifies losses. Excessive leverage can quickly lead to financial distress if the market turns against you. It’s important to use leverage judiciously and only within your risk capacity.
Emotional Control is an often-overlooked aspect of risk management. Fear and greed can cloud judgment and lead to irrational investment decisions. Maintaining emotional control is essential for making rational decisions based on sound financial principles.
By implementing these risk management strategies, investors can enhance their chances of success in the stock market. It’s important to remember that risk management is an ongoing process that requires constant attention and adaptation. By taking a proactive approach to risk, investors can protect their capital and achieve their financial goals.
Building a Winning Stock Portfolio for Long-Term Growth
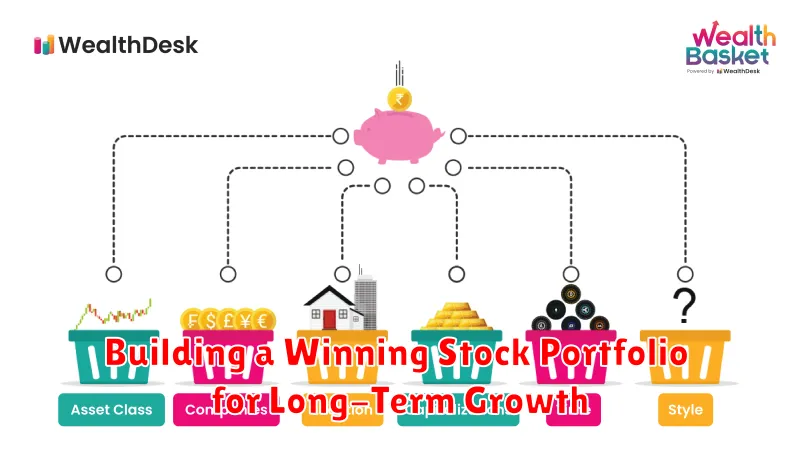
Investing in the stock market can be a daunting task, especially for beginners. With so many stocks to choose from and a constantly fluctuating market, it can be difficult to know where to start. However, building a well-diversified portfolio that aligns with your investment goals and risk tolerance is crucial for long-term growth. Here’s a comprehensive guide to help you embark on your investing journey.
Define Your Investment Goals and Time Horizon
Before diving into stock selection, it’s essential to have a clear understanding of your investment objectives and the timeframe you’re working with. Are you saving for retirement, a down payment on a house, or a specific financial milestone? Your goals will influence your investment strategy and risk tolerance.
Assess Your Risk Tolerance
Every investor has a different level of risk tolerance. Some are comfortable with the possibility of significant fluctuations in their portfolio value, while others prefer a more conservative approach. Understanding your own risk tolerance is crucial in determining the type of investments you’re willing to make.
Diversify Your Portfolio
Diversification is key to mitigating risk. Instead of putting all your eggs in one basket, spreading your investments across different asset classes, sectors, and companies can help reduce the impact of any single investment performing poorly.
Choose the Right Stocks
There are numerous factors to consider when selecting stocks, including:
- Financial Health: Analyze a company’s financial statements to assess its profitability, debt levels, and cash flow.
- Industry Outlook: Research the industry the company operates in to determine its future growth potential.
- Management Team: Evaluate the leadership team’s experience, vision, and track record.
- Valuation: Compare the company’s current stock price to its intrinsic value to determine if it’s fairly priced.
Invest for the Long Term
The stock market is inherently volatile, and short-term fluctuations are inevitable. It’s crucial to have a long-term investment horizon and avoid panicking during market downturns. Remember, investing is a marathon, not a sprint.
Monitor and Adjust Your Portfolio
Regularly reviewing and adjusting your portfolio is essential to ensure it’s still aligned with your investment goals and risk tolerance. You may need to rebalance your portfolio or make changes to your investment strategy as your circumstances change.
Consider Professional Advice
If you’re unsure about where to start or feel overwhelmed by the process, seeking guidance from a financial advisor can be beneficial. A professional advisor can provide personalized advice based on your specific situation and help you create a customized investment plan.
Common Stock Market Mistakes to Avoid

Investing in the stock market can be a great way to grow your wealth over time, but it’s important to be aware of the common mistakes that investors make. By avoiding these pitfalls, you can increase your chances of success. Here are some of the most common mistakes to avoid:
1. Investing without a plan: One of the biggest mistakes investors make is investing without a plan. Without a clear investment strategy, you’re more likely to make impulsive decisions based on emotion rather than logic. Before you start investing, take the time to develop a plan that outlines your investment goals, risk tolerance, and time horizon.
2. Not doing your research: Another common mistake is not doing your research before investing. Don’t just invest in a company because you’ve heard it’s a good idea. Take the time to understand the company’s financials, its competitive landscape, and its future prospects. You can use resources like online financial news websites and annual reports to do your research.
3. Investing based on emotions: It’s natural to feel excited when the stock market is doing well and fearful when it’s doing poorly. However, it’s important to avoid making investment decisions based on your emotions. If you’re feeling anxious, it’s best to wait until you’ve calmed down before making any decisions. When you’re feeling excited, it’s important to remember that the market can go up and down.
4. Trying to time the market: Many investors try to “time the market,” meaning they try to buy low and sell high. However, this is incredibly difficult to do consistently, and most investors end up losing money. Instead of trying to predict market movements, focus on building a diversified portfolio of investments that you can hold for the long term.
5. Not diversifying your portfolio: Diversification is one of the most important concepts in investing. By investing in a variety of different assets, you can reduce your risk and increase your potential for returns. Don’t put all your eggs in one basket, diversify your portfolio across different asset classes, such as stocks, bonds, and real estate.
6. Not adjusting your portfolio: As you get older, your investment goals and risk tolerance may change. It’s important to periodically review your portfolio and make adjustments as needed. For example, as you get closer to retirement, you may want to shift your portfolio towards more conservative investments.
7. Not taking advantage of tax benefits: The stock market offers a number of tax benefits that can help you save money. Be sure to take advantage of these benefits, such as tax-advantaged retirement accounts like 401(k)s and IRAs.
8. Not understanding fees: Before you invest in any fund or investment, be sure to understand the fees associated with it. High fees can eat into your returns over time. Look for funds with low expense ratios and avoid investments with high commissions.
By avoiding these common mistakes, you can increase your chances of success in the stock market. Remember, investing is a marathon, not a sprint. Be patient, stay disciplined, and don’t let emotions get in the way of your long-term investment goals.